Generating callgraph diagrams with gperf2dot
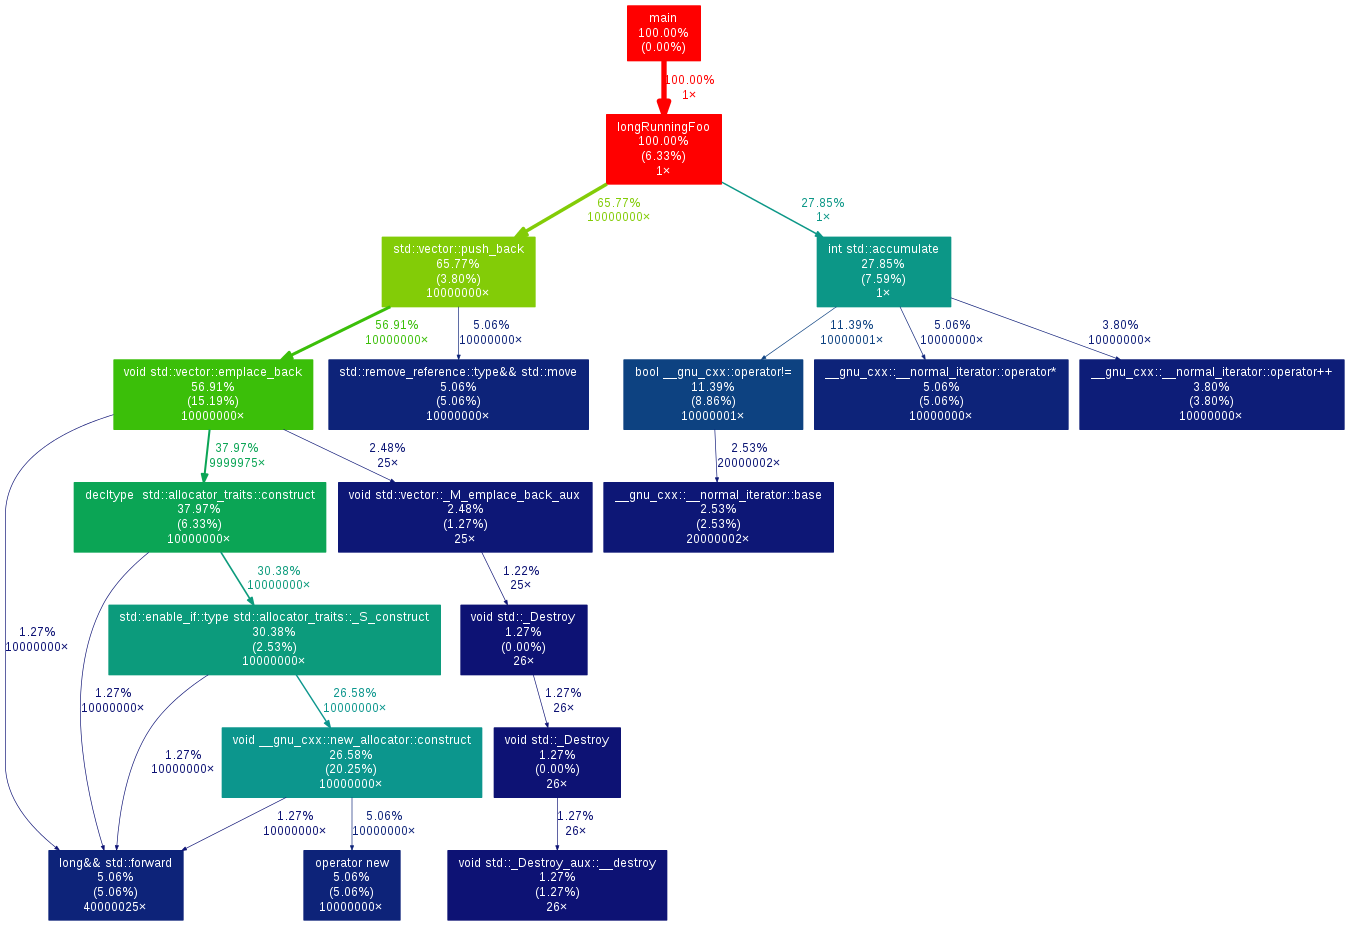
suggest changeFor more complex applications, flat execution profiles may be difficult to follow. This is why many profiling tools also generate some form of annotated callgraph information.
gperf2dot converts text output from many profilers (Linux perf, callgrind, oprofile etc.) into a callgraph diagram. You can use it by running your profiler (example for gprof):
# compile with profiling flags
g++ *.cpp -pg
# run to generate profiling data
./main
# translate profiling data to text, create image
gprof ./main | gprof2dot -s | dot -Tpng -o output.png
Found a mistake? Have a question or improvement idea?
Let me know.
Table Of Contents