Pie Chart with Demo
suggest change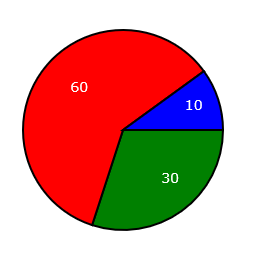
<!doctype html>
<html>
<head>
<style>
    body{ background-color:white; }
    #canvas{border:1px solid red; }
</style>
<script>
window.onload=(function(){

    var canvas = document.getElementById("canvas");
    var ctx = canvas.getContext("2d");
    ctx.lineWidth = 2;
    ctx.font = '14px verdana';

    var PI2 = Math.PI * 2;
    var myColor = ["Green", "Red", "Blue"];
    var myData = [30, 60, 10];
    var cx = 150;
    var cy = 150;
    var radius = 100;

    pieChart(myData, myColor);

    function pieChart(data, colors) {
      var total = 0;
      for (var i = 0; i < data.length; i++) {
        total += data[i];
      }

      var sweeps = []
      for (var i = 0; i < data.length; i++) {
        sweeps.push(data[i] / total * PI2);
      }

      var accumAngle = 0;
      for (var i = 0; i < sweeps.length; i++) {
        drawWedge(accumAngle, accumAngle + sweeps[i], colors[i], data[i]);
        accumAngle += sweeps[i];
      }
    }

    function drawWedge(startAngle, endAngle, fill, label) {
      // draw the wedge
      ctx.beginPath();
      ctx.moveTo(cx, cy);
      ctx.arc(cx, cy, radius, startAngle, endAngle, false);
      ctx.closePath();
      ctx.fillStyle = fill;
      ctx.strokeStyle = 'black';
      ctx.fill();
      ctx.stroke();

      // draw the label
      var midAngle = startAngle + (endAngle - startAngle) / 2;
      var labelRadius = radius * .65;
      var x = cx + (labelRadius) * Math.cos(midAngle);
      var y = cy + (labelRadius) * Math.sin(midAngle);
      ctx.fillStyle = 'white';
      ctx.fillText(label, x, y);
    }

}); // end $(function(){});
</script>
</head>
<body>
    <canvas id="canvas" width=512 height=512></canvas>
</body>
</html>
Found a mistake? Have a question or improvement idea?
Let me know.
Table Of Contents