Debugging EXC BAD ACCESS
suggest changeEXC_BAD_ACCESS means the process tried to access memory in an invalid way, like dereferencing a NULL pointer or writing to read-only memory. This is the hardest kind of crash to debug, because it usually does not have an error message, and some crashes can be very difficult to reproduce and/or occur in code completely unrelated to the problem. This error is very rare in Swift, but if it occurs, you can often get easier-to-debug crashes by reducing compiler optimizations.
Most EXC_BAD_ACCESS errors are caused by trying to dereference a NULL pointer. If this is the case, the address listed in the red arrow will usually be a hexadecimal number that is lower than a normal memory address, often 0x0. Set breakpoints in the debugger or add occasional printf/NSLog statements to find out why that pointer is NULL.
An EXC_BAD_ACCESS that occurs less reliably or makes no sense at all could be the result of a memory management problem. Common problems that can cause this are:
- Using memory that has been deallocated
- Trying to write past the end of a C array or other kind of buffer
- Using a pointer which has not been initialized
In the Diagnostics section of the Scheme Editor, Xcode includes a few useful tools to help debug memory problems:
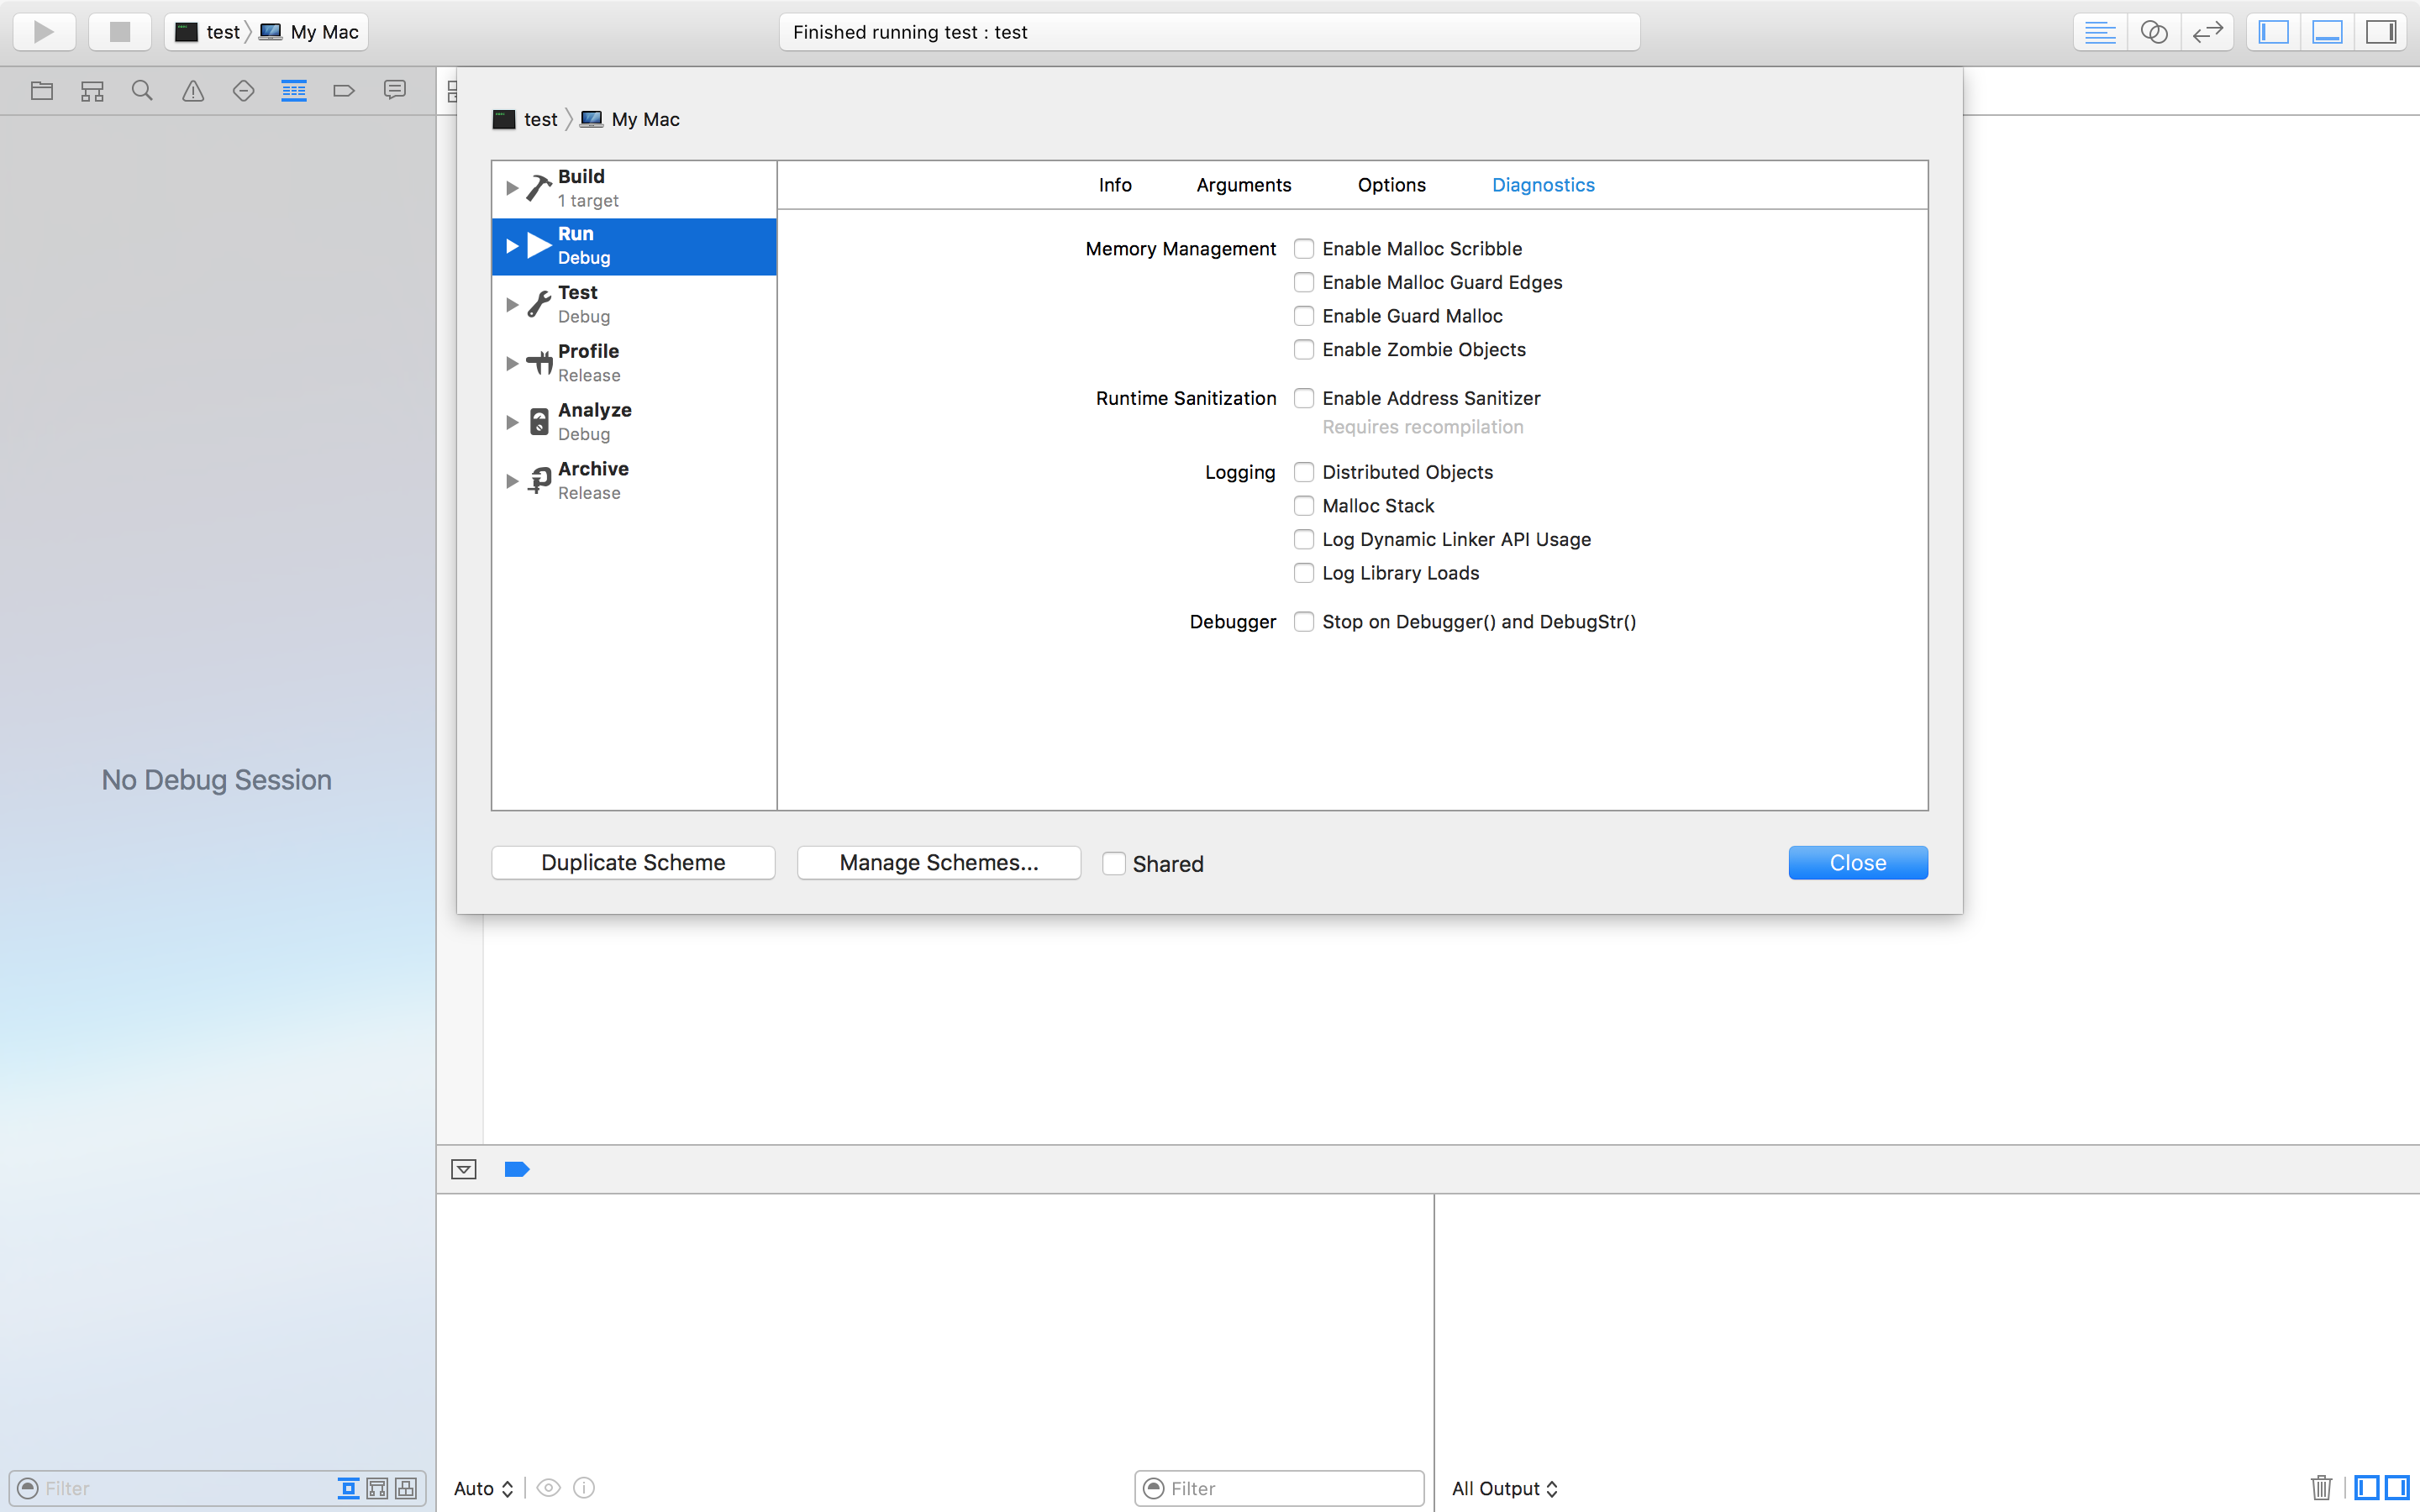
The Address Sanitizer adds lots of checks that will stop the app whenever memory problems occur and provide a helpful error message detailing exactly what happened. Zombie Objects detects problems with deallocated Objective-C objects, but you shouldn’t get these kinds of problems with Automatic Reference Counting turned on.