Time Profiler
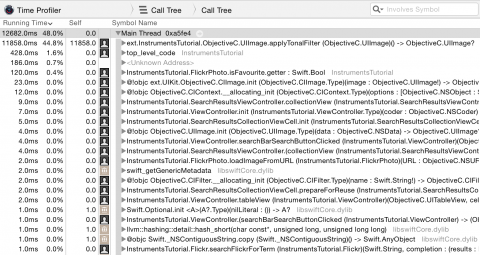
suggest changeThe first instrument you’ll look at is the Time Profiler. At measured intervals, Instruments will halt the execution of the program and take a stack trace on each running thread. Think of it as pressing the pause button in Xcode’s debugger.Here’s a sneak preview of the Time Profiler :-
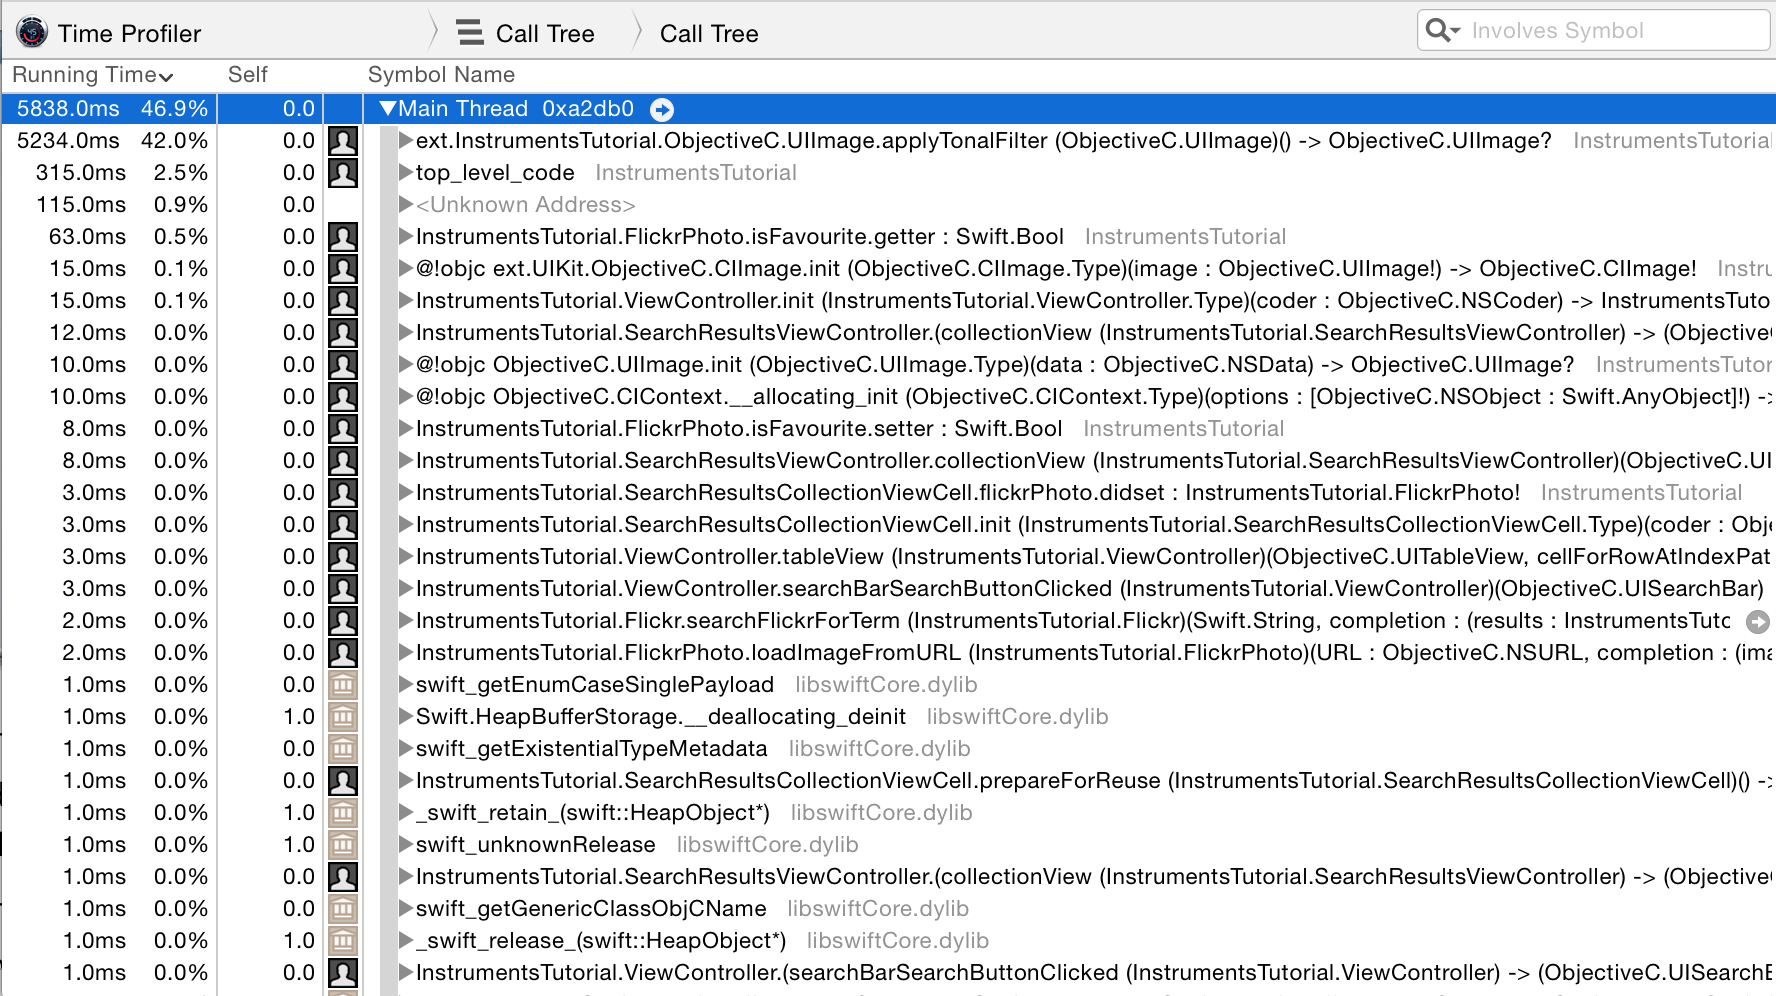
This screen displays the Call Tree. The Call Tree shows the amount of time spent executing in various methods within an app. Each row is a different method that the program’s execution path has followed. The time spent in each method can be determined from the number of times the profiler is stopped in each method. For instance, if 100 samples are done at 1 millisecond intervals, and a particular method is found to be at the top of the stack in 10 samples, then you can deduce that approximately 10% of the total execution time — 10 milliseconds — was spent in that method. It’s a fairly crude approximation, but it works!
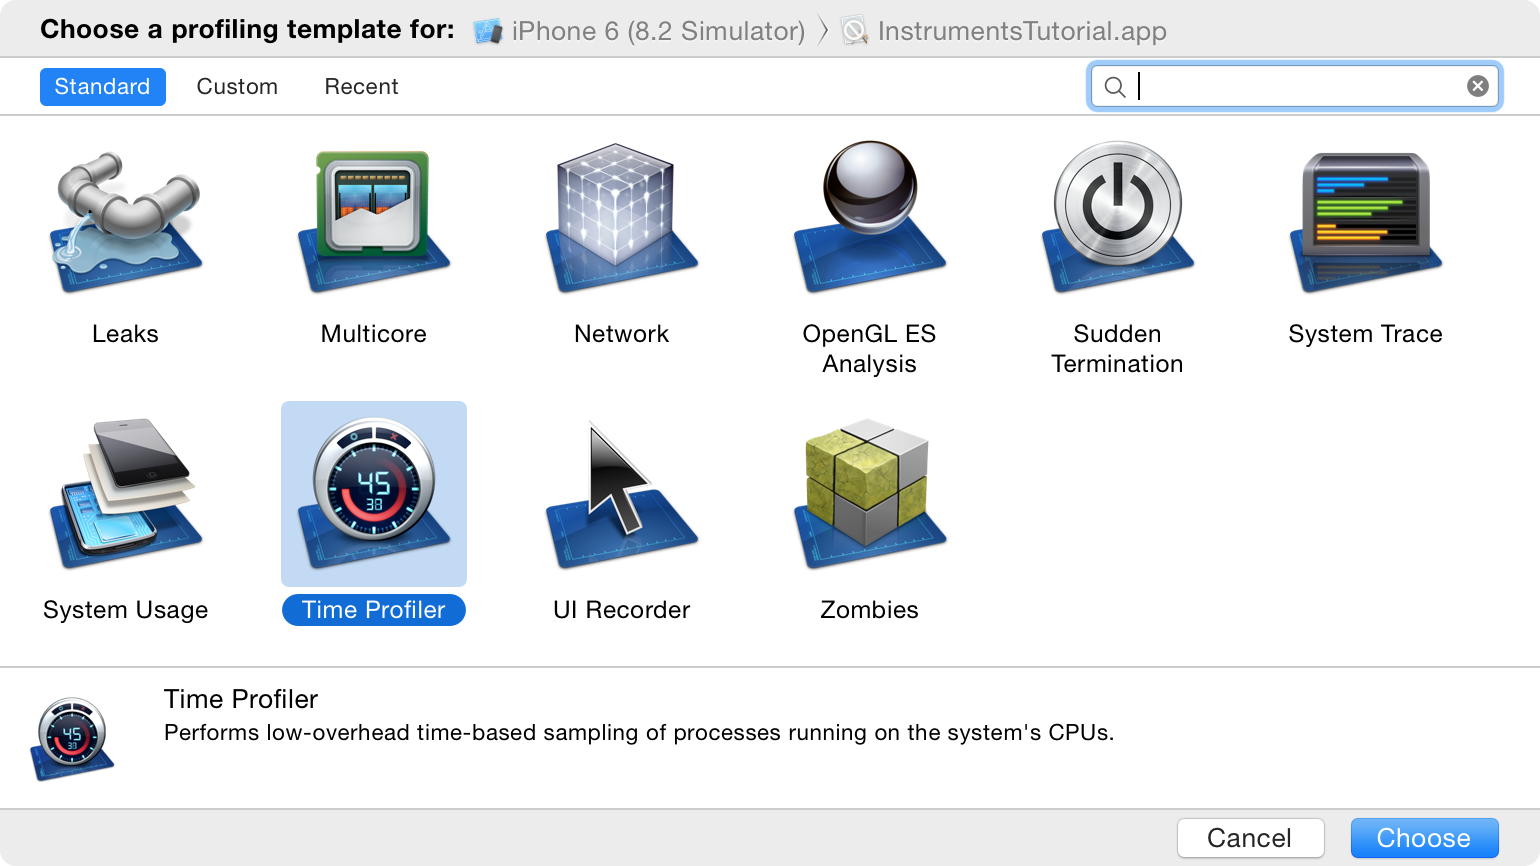
From Xcode’s menu bar, select Product\Profile, or press ⌘I. This will build the app and launch Instruments. You will be greeted with a selection window that looks like this:
These are all different templates that come with Instruments.
Select the Time Profiler instrument and click Choose. This will open up a new Instruments document. Click the red record button in the top left to start recording and launch the app. You may be asked for your password to authorize Instruments to analyze other processes — fear not, it’s safe to provide here! In the Instruments window, you can see the time counting up, and a little arrow moving from left to right above the graph in the center of the screen. This indicates that the app is running.
Now, start using the app. Search for some images, and drill down into one or more of the search results. You have probably noticed that going into a search result is tediously slow, and scrolling through a list of search results is also incredibly annoying – it’s a terribly clunky app!
Well, you’re in luck, for you’re about to embark on fixing it! However, you’re first going to get a quick run down on what you’re looking at in Instruments. First, make sure the view selector on the right hand side of the toolbar has both options selected, like so:

That will ensure that all panels are open. Now study the screenshot below and the explanation of each section beneath it:
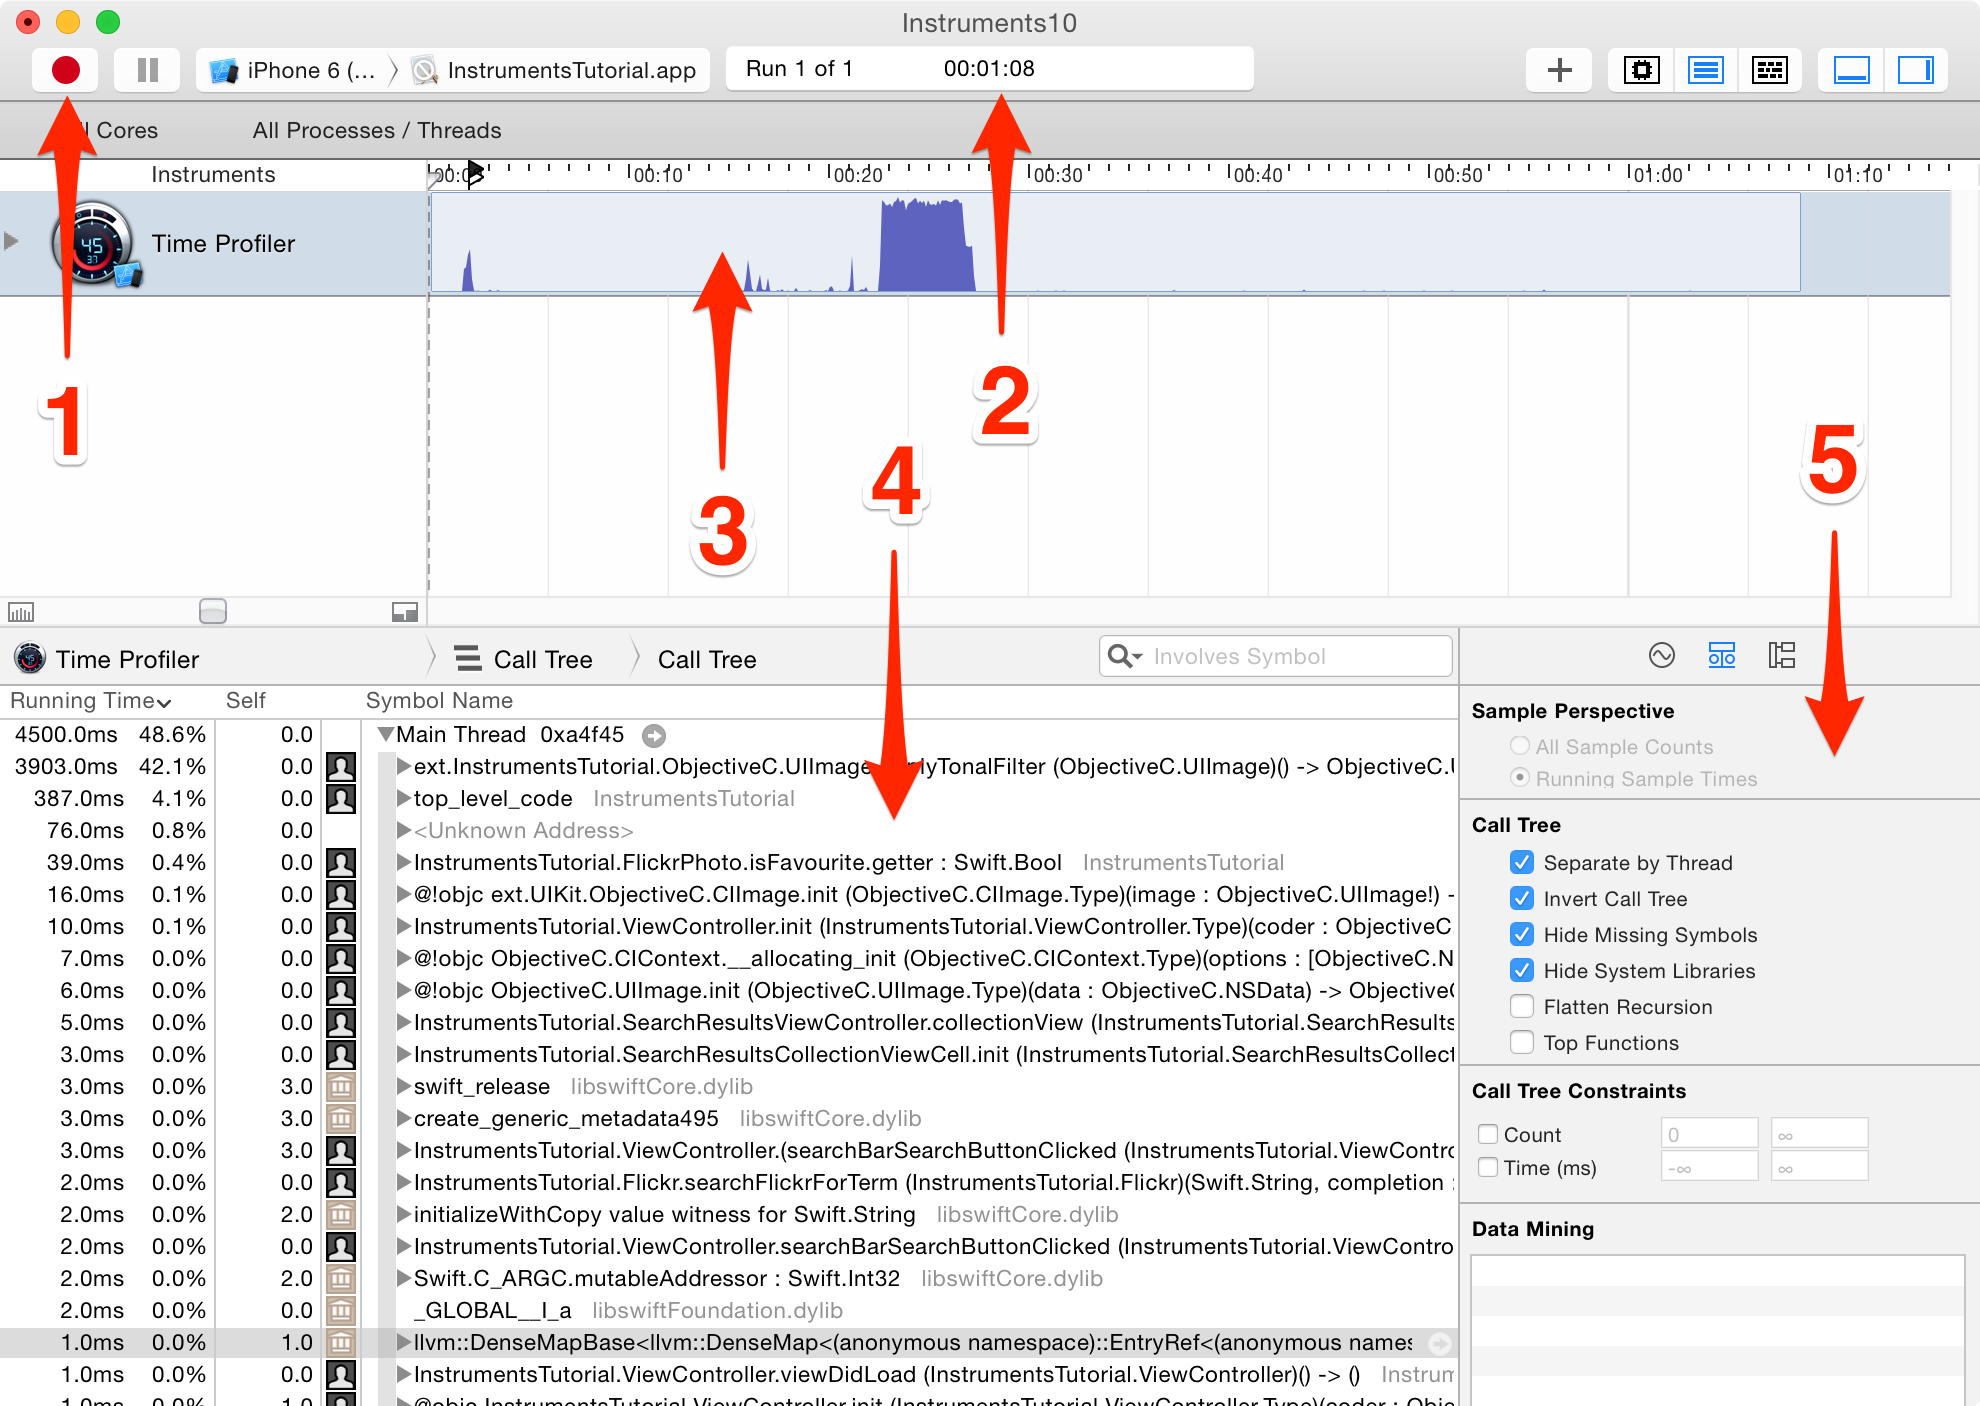
1. These are the recording controls. The red ‘record’ button will stop & start the app currently being profiled when it is clicked (it toggles between a record and stop icon). The pause button does exactly what you’d expect and pauses the current execution of the app.
2. This is the run timer. The timer counts how long the app being profiled has been running, and how many times it has been run. If you stop and then restart the app using the recording controls, that would start a new run and the display would then show Run 2 of 2.
3. This is called a track. In the case of the Time Profiler template you selected, there’s just one instrument so there’s just one track. You’ll learn more about the specifics of the graph shown here later in the tutorial.
4. This is the detail panel. It shows the main information about the particular instrument you’re using. In this case, it’s showing the methods which are “hottest” — that is, the ones that have used up the most CPU time. If you click on the bar at the top which says Call Tree (the left hand one) and select Sample List, then you are presented with a different view of the data. This view is showing every single sample. Click on a few samples, and you’ll see the captured stack trace appear in the Extended Detail inspector.
5. This is the inspectors panel. There are three inspectors: Record Settings, Display Settings, and Extended Detail. You’ll be learning more about some of these options shortly.
Drilling Deep
Perform an image search, and drill into the results. I personally like searching for “dog”, but choose whatever you wish – you might be one of those cat people!
Now, scroll up and down the list a few times so that you’ve got a good amount of data in the Time Profiler. You should notice the numbers in the middle of the screen changing and the graph filling in; this tells you that CPU cycles are being used.
You really wouldn’t expect any UI to be as clunky as this no table view is ready to ship until it scrolls like butter! To help pinpoint the problem, you need to set some options.
On the right hand side, select the Display Settings inspector (or press ⌘+2). In the inspector, under the Call Tree section, select Separate by Thread, Invert Call Tree, Hide Missing Symbols and Hide System Libraries. It will look like this:
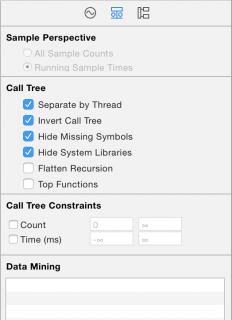
Here’s what each option is doing to the data displayed in the table to the left:
Separate by Thread: Each thread should be considered separately. This enables you to understand which threads are responsible for the greatest amount of CPU use.
Invert Call Tree: With this option, the stack trace is considered from top to bottom. This is usually what you want, as you want to see the deepest methods where the CPU is spending its time.
Hide Missing Symbols: If the dSYM file cannot be found for your app or a system framework, then instead of seeing method names (symbols) in the table, you’ll just see hex values corresponding to addresses inside the binary. If this option is selected, then only fully resolved symbols are displayed and the unresolved hex values are hidden. This helps to declutter the data presented.
Hide System Libraries: When this option is selected, only symbols from your own app are displayed. It’s often useful to select this option, since usually you only care about where the CPU is spending time in your own code – you can’t do much about how much CPU the system libraries are using!
Flatten Recursion: This option treats recursive functions (ones which call themselves) as one entry in each stack trace, rather than multiple.
Top Functions: Enabling this makes Instruments consider the total time spent in a function as the sum of the time directly within that function, as well as the time spent in functions called by that function.
So if function A calls B, then A’s time is reported as the time spent in A PLUS the time spent in B. This can be really useful, as it lets you pick the largest time figure each time you descend into the call stack, zeroing in on your most time-consuming methods.
If you’re running an Objective-C app, there’s also an option of Show Obj-C Only: If this is selected, then only Objective-C methods are displayed, rather than any C or C++ functions. There are none in your program, but if you were looking at an OpenGL app, it might have some C++, for example.
Although some values may be slightly different, the order of the entries should be similar to the table below once you have enabled the options above:
Well, that certainly doesn’t look too good. The vast majority of time is spent in the method that applies the ‘tonal’ filter to the thumbnail photos. That shouldn’t come as too much of a shock to you, as the table loading and scrolling were the clunkiest parts of the UI, and that’s when the table cells are constantly being updated.
To find out more about what’s going on within that method, double click its row in the table. Doing so will bring up the following view:
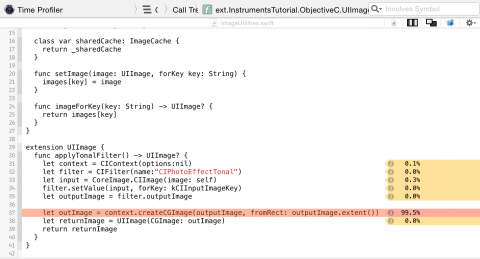
Well that’s interesting, isn’t it! applyTonalFilter() is a method added to UIImage in an extension, and almost 100% of the time spent in it is spent creating the CGImage output after applying the image filter.
There’s not really much that can be done to speed this up: creating the image is quite an intensive process, and takes as long as it takes. Let’s try stepping back and seeing where applyTonalFilter() is called from. Click Call Tree in the breadcrumb trail at the top of the code view to get back to the previous screen:

Now click the small arrow to the left of the applyTonalFilter row at the top of the table. This will unfold the Call Tree to show the caller of applyTonalFilter. You may need to unfold the next row too; when profiling Swift, there will sometimes be duplicate rows in the Call Tree, prefixed with @objc. You’re interested in the first row that’s prefixed with your app’s target name (InstrumentsTutorial):
In this case, this row refers to the results collection view’s cellForItemAtIndexPath. Double click the row to see the associated code from the project.
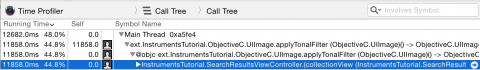
Now you can see what the problem is. The method to apply the tonal filter takes a long time to execute, and it’s called directly from cellForItemAtIndexPath, which will block the main thread (and therefore the entire UI) each time it’s ask for a filtered image.
Allocations
There are detailed information about all the objects that are being created and the memory that backs them; it also shows you retain counts of each object. To start afresh with a new instruments profile, quit the Instruments app. This time, build and run the app, and open the Debug Navigator in the Navigators area. Then click on Memory to display graphs of memory usage in the main window:
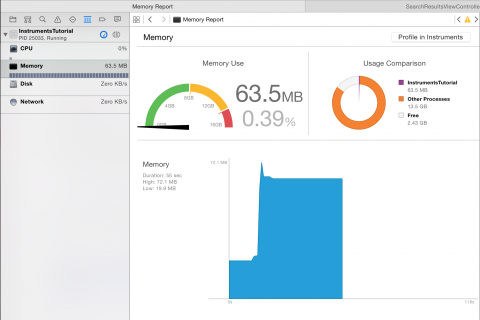
These graphs are useful for to get a quick idea about how your app is performing. But you’re going to need a bit more power. Click the Profile in Instruments button and then Transfer to bring this session into Instruments. The Allocations instrument will start up automatically.
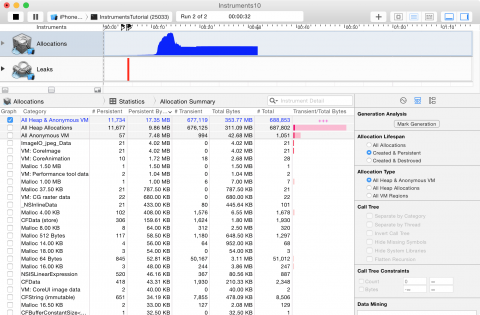
This time you’ll notice two tracks. One is called Allocations, and one is called Leaks. The Allocations track will be discussed in detail later on; the Leaks track is generally more useful in Objective-C, and won’t be covered in this tutorial. So what bug are you going to track down next? There’s something hidden in the project that you probably don’t know is there. You’ve likely heard about memory leaks. But what you may not know is that there are actually two kinds of leaks:
True memory leaks are where an object is no longer referenced by anything but still allocated – that means the memory can never be re-used. Even with Swift and ARC helping manage memory, the most common kind of memory leak is a retain cycle or strong reference cycle. This is when two objects hold strong references to one another, so that each object keeps the other one from being deallocated. This means that their memory is never released!
Unbounded memory growth is where memory continues to be allocated and is never given a chance to be deallocated. If this continues forever, then at some point the system’s memory will be filled and you’ll have a big memory problem on your hands. In iOS this means that the app will be killed by the system.
With the Allocations instrument running on the app, make five different searches in the app but do not drill down into the results yet. Make sure the searches have some results! Now let the app settle a bit by waiting a few seconds.
You should have noticed that the graph in the Allocations track has been rising. This is telling you that memory is being allocated. It’s this feature that will guide you to finding unbounded memory growth.
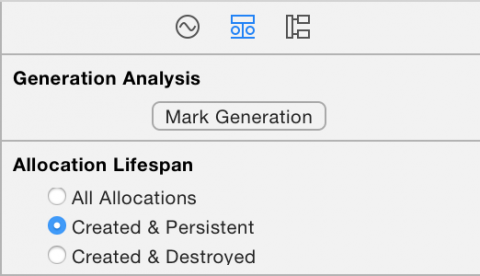
What you’re going to perform is a generation analysis. To do this, press the button called Mark Generation. You’ll find the button at the top of the Display Settings inspector:
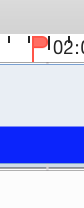
Press it and you will see a red flag appear in the track, like so:
The purpose of generation analysis is to perform an action multiple times, and see if memory is growing in an unbounded fashion. Drill into a search, wait a few seconds for the images to load, and then go back to the main page. Then mark the generation again. Do this repeatedly for different searches. After a drilling into a few searches, Instruments will look like this:
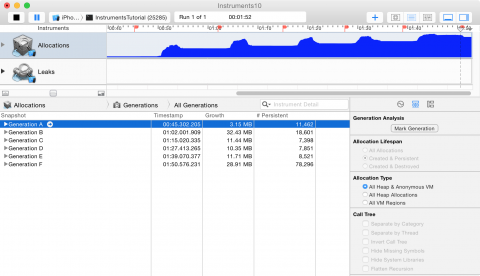
At this point, you should be getting suspicious. Notice how the blue graph is going up with each search that you drill into. Well, that certainly isn’t good. But wait, what about memory warnings? You know about those, right? Memory warnings are iOS’s way of telling an app that things are getting tight in the memory department, and you need to clear out some memory.
It’s possible that this growth is not just due to your app; it could be something in the depths of UIKit that’s holding onto memory. Give the system frameworks and your app a chance to clear their memory first before pointing a finger at either one.
Simulate a memory warning by selecting Instrument\Simulate Memory Warning in Instruments’ menu bar, or Hardware\Simulate Memory Warning from the simulator’s menu bar. You’ll notice that memory usage dips a little, or perhaps not at all. Certainly not back to where it should be. So there’s still unbounded memory growth happening somewhere.
The reason for marking a generation after each iteration of drilling into a search is that you can see what memory has been allocated between each generation. Take a look in the detail panel and you’ll see a bunch of generations.