Printing to a browsers debugging console
suggest changeA browser’s debugging console can be used in order to print simple messages. This debugging or web console can be directly opened in the browser (F12 key in most browsers – see Remarks below for further information) and the log method of the console Javascript object can be invoked by typing the following:
console.log('My message');Then, by pressing Enter, this will display My message in the debugging console.
console.log() can be called with any number of arguments and variables available in the current scope. Multiple arguments will be printed in one line with a small space between them.
var obj = { test: 1 };
console.log(['string'], 1, obj, window);
The log method will display the following in the debugging console:
['string'] 1 Object { test: 1 } Window { /* truncated */ }Beside plain strings, console.log() can handle other types, like arrays, objects, dates, functions, etc.:
console.log([0, 3, 32, 'a string']);
console.log({ key1: 'value', key2: 'another value'});
Displays:
Array [0, 3, 32, 'a string']
Object { key1: 'value', key2: 'another value'}
Nested objects may be collapsed:
console.log({ key1: 'val', key2: ['one', 'two'], key3: { a: 1, b: 2 } });Displays:
Object { key1: 'val', key2: Array[2], key3: Object }Certain types such as Date objects and functions may be displayed differently:
console.log(new Date(0));
console.log(function test(a, b) { return c; });
Displays:
Wed Dec 31 1969 19:00:00 GMT-0500 (Eastern Standard Time)
function test(a, b) { return c; }
Other print methods
In addition to the log method, modern browsers also support similar methods:
console.info– small informative icon (ⓘ) appears on the left side of the printed string(s) or object(s).console.warn– small warning icon (!) appears on the left side. In some browsers, the background of the log is yellow.console.error– small times icon (⊗) appears on the left side. In some browsers, the background of the log is red.console.timeStamp– outputs the current time and a specified string, but is non-standard:
console.timeStamp('msg');Displays:
00:00:00.001 msgconsole.trace– outputs the current stack trace or displays the same output as thelogmethod if invoked in the global scope.
function sec() {
   first();
}
function first() {
   console.trace();
}
sec();
Displays:
first
sec
(anonymous function)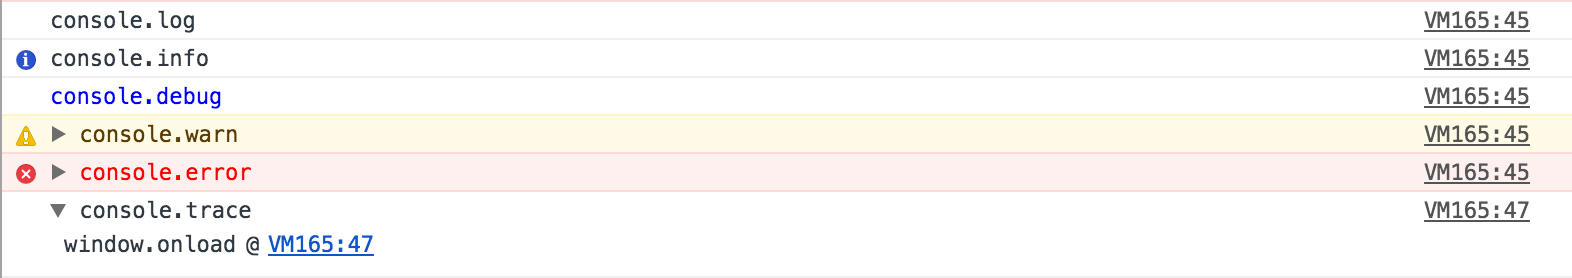
The above image shows all the functions, with the exception of timeStamp, in Chrome version 56.
These methods behave similarly to the log method and in different debugging consoles may render in different colors or formats.
In certain debuggers, the individual objects information can be further expanded by clicking the printed text or a small triangle (►) which refers to the respective object properties. These collapsing object properties can be open or closed on log. See the console.dir for additional information on this