Core node.js debugger and node inspector
suggest changeUsing core debugger
Node.js provides a build in non graphical debugging utility. To start the build in the debugger, start the application with this command:
node debug filename.jsConsider the following simple Node.js application contained in the debugDemo.js
'use strict';

function addTwoNumber(a, b){
// function returns the sum of the two numbers
debugger
  return a + b;
}

var result = addTwoNumber(5, 9);
console.log(result);
The keyword debugger will stop the debugger at that point in the code.
Command reference
- Stepping
cont, c - Continue execution next, n - Step next step, s - Step in out, o - Step out - Breakpoints
setBreakpoint(), sb() - Set breakpoint on current line
setBreakpoint(line), sb(line) - Set breakpoint on specific line
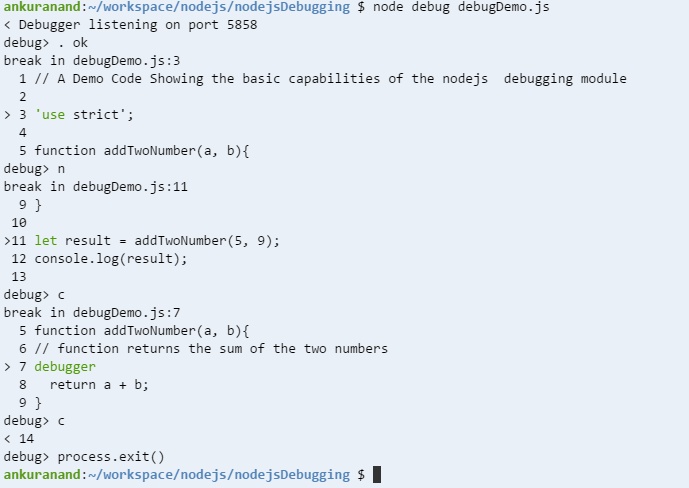
To Debug the above code run the following command
node debug debugDemo.jsOnce the above commands runs you will see the following output. To exit from the debugger interface, type process.exit()
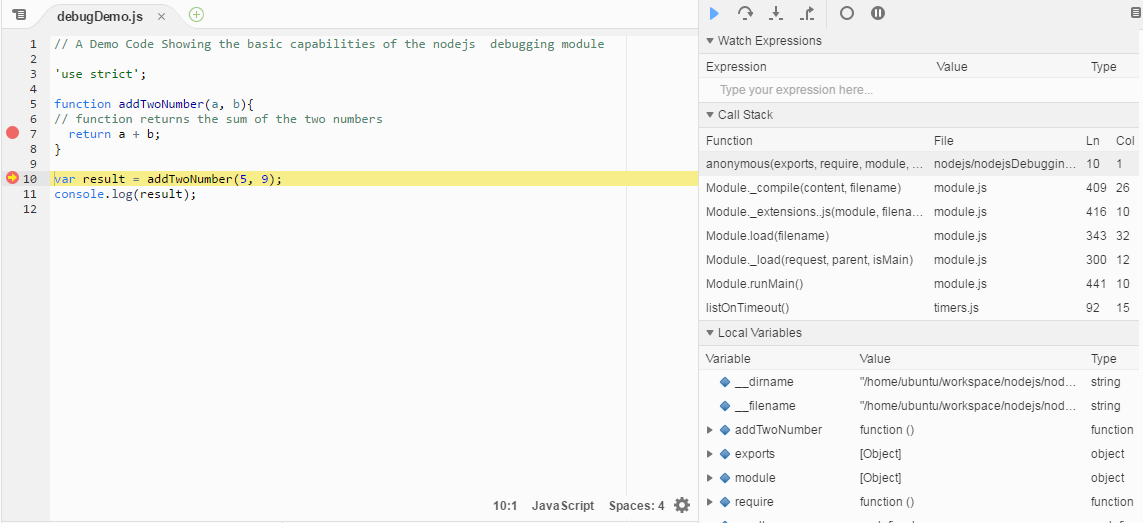
Use watch(expression) command to add the variable or expression whose value you want to watch and restart to restart the app and debugging.
Use repl to enter code interactively. The repl mode has the same context as the line you are debugging. This allows you to examine the contents of variables and test out lines of code. Press Ctrl+C to leave the debug repl.
Using Built-in Node inspector
You can run node’s built in v8 inspector! The node-inspector plug-in is not needed anymore.
Simply pass the inspector flag and you’ll be provided with a URL to the inspector
node --inspect server.jsUsing Node inspector
Install the node inspector:
npm install -g node-inspectorRun your app with the node-debug command:
node-debug filename.jsAfter that, hit in Chrome:
http://localhost:8080/debug?port=5858Sometimes port 8080 might not be available on your computer. You may get the following error:
Cannot start the server at 0.0.0.0:8080. Error: listen EACCES.
In this case, start the node inspector on a different port using the following command.
$node-inspector --web-port=6500You will see something like this: