Profiling a simple node application
suggest changeStep 1 : Install the node-inspector package using npm globally on you machine
$ npm install -g node-inspectorStep 2 : Start the node-inspector server
$ node-inspectorStep 3 : Start debugging your node application
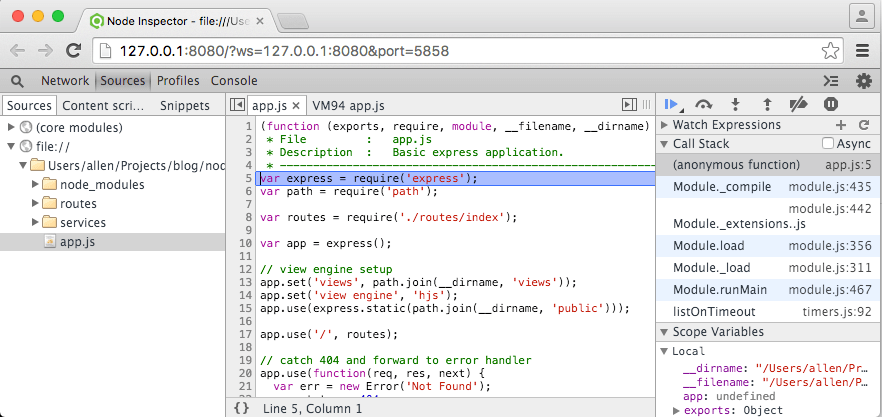
$ node --debug-brk your/short/node/script.jsStep 4 : Open http://127.0.0.1:8080/?port=5858 in the Chrome browser. And you will see a chrom-dev tools interface with your nodejs application source code in left panel . And since we have used debug break option while debugging the application the code execution will stop at the first line of code.
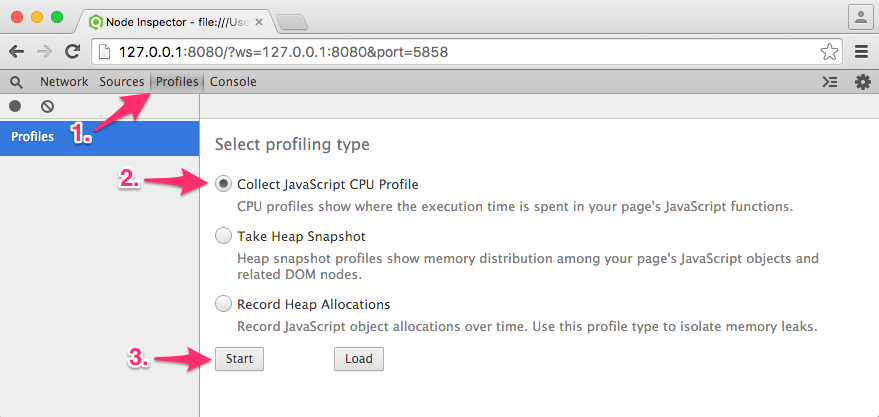
Step 5 : This is the easy part where you switch to the profiling tab and start profiling the application . In case you want get the profile for a particular method or flow make sure the code execution is break-pointed just before that piece of code is executed.
Step 6 : Once you have recorded your CPU profile or heap dump/snapshot or heap allocation you can then view the results in the same window or save them to local drive for later analysis or comparison with other profiles.
You can use this articles to know how to read the profiles :