A Simple Plot in Matplotlib
suggest changeThis example illustrates how to create a simple sine curve using Matplotlib
# Plotting tutorials in Python
# Launching a simple plot

import numpy as np
import matplotlib.pyplot as plt

# angle varying between 0 and 2*pi
x = np.linspace(0, 2.0*np.pi, 101)
y = np.sin(x)                        # sine function

plt.plot(x, y)
plt.show()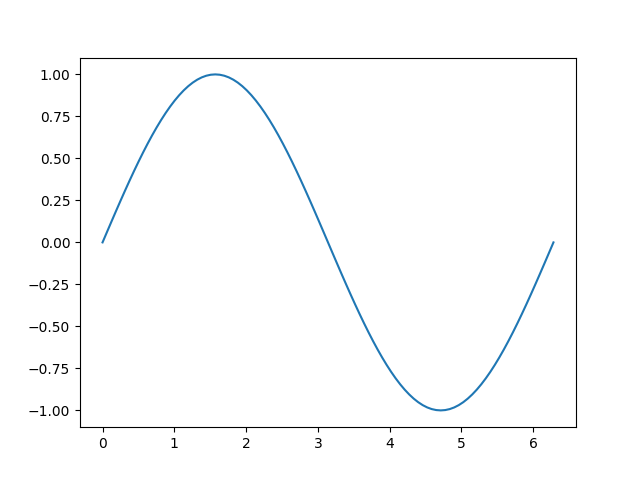
A sample sine curve
Found a mistake? Have a question or improvement idea?
Let me know.
Table Of Contents