Making multiple Plots in the same figure using plot superimposition with separate plot commands
suggest changeSimilar to the previous example, here, a sine and a cosine curve are plotted on the same figure using separate plot commands. This is more Pythonic and can be used to get separate handles for each plot.
# Plotting tutorials in Python
# Adding Multiple plots by superimposition
# Good for plots sharing similar x, y limits
# Using multiple plot commands
# Much better and preferred than previous

import numpy as np
import matplotlib.pyplot as plt

x = np.linspace(0, 2.0*np.pi, 101)
y = np.sin(x)
z = np.cos(x)

# values for making ticks in x and y axis
xnumbers = np.linspace(0, 7, 15)
ynumbers = np.linspace(-1, 1, 11)

plt.plot(x, y, color='r', label='sin') # r - red colour
plt.plot(x, z, color='g', label='cos') # g - green colour
plt.xlabel("Angle in Radians")
plt.ylabel("Magnitude")
plt.title("Plot of some trigonometric functions")
plt.xticks(xnumbers)
plt.yticks(ynumbers)
plt.legend()
plt.grid()
plt.axis([0, 6.5, -1.1, 1.1]) # [xstart, xend, ystart, yend]
plt.show()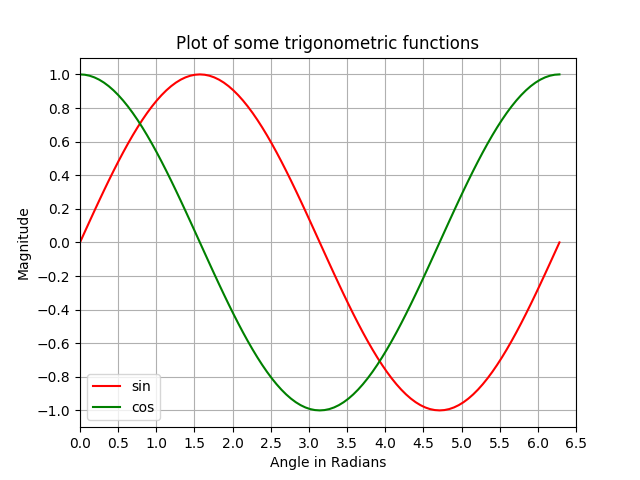
Found a mistake? Have a question or improvement idea?
Let me know.
Table Of Contents