Matplotlib
suggest changeMatplotlib is a mathematical plotting library for Python that provides a variety of different plotting functionality.
The matplotlib documentation can be found here, with the SO Docs being available here.
Matplotlib provides two distinct methods for plotting, though they are interchangable for the most part:
- Firstly, matplotlib provides the
pyplotinterface, direct and simple-to-use interface that allows plotting of complex graphs in a MATLAB-like style. - Secondly, matplotlib allows the user to control the different aspects (axes, lines, ticks, etc) directly using an object-based system. This is more difficult but allows complete control over the entire plot.
Below is an example of using the pyplot interface to plot some generated data:
import matplotlib.pyplot as plt

# Generate some data for plotting.
x = [0, 1, 2, 3, 4, 5, 6]
y = [i**2 for i in x]

# Plot the data x, y with some keyword arguments that control the plot style.
# Use two different plot commands to plot both points (scatter) and a line (plot).

plt.scatter(x, y, c='blue', marker='x', s=100) # Create blue markers of shape "x" and size 100
plt.plot(x, y, color='red', linewidth=2) # Create a red line with linewidth 2.

# Add some text to the axes and a title.
plt.xlabel('x data')
plt.ylabel('y data')
plt.title('An example plot')

# Generate the plot and show to the user.
plt.show()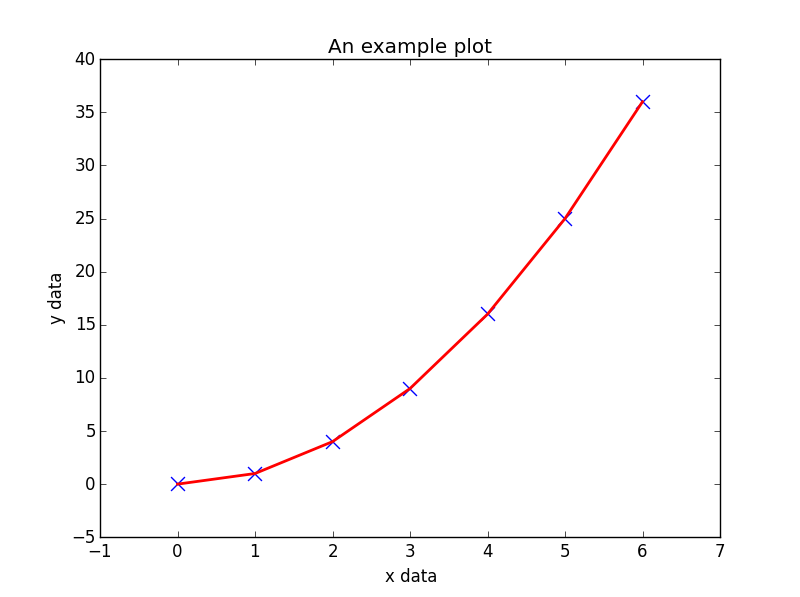
Note that plt.show() is known to be problematic in some environments due to running matplotlib.pyplot in interactive mode, and if so, the blocking behaviour can be overridden explicitly by passing in an optional argument, plt.show(block=True), to alleviate the issue.
Found a mistake? Have a question or improvement idea?
Let me know.
Table Of Contents