Plotly
suggest changePlotly is a modern platform for plotting and data visualization. Useful for producing a variety of plots, especially for data sciences, Plotly is available as a library for Python, R, JavaScript, Julia and, MATLAB. It can also be used as a web application with these languages.
Users can install plotly library and use it offline after user authentication. The installation of this library and offline authentication is given here. Also, the plots can be made in Jupyter Notebooks as well.
Usage of this library requires an account with username and password. This gives the workspace to save plots and data on the cloud.
The free version of the library has some slightly limited features and designed for making 250 plots per day. The paid version has all the features, unlimited plot downloads and more private data storage. For more details, one can visit the main page here.
For documentation and examples, one can go here
A sample plot from the documentation examples:
import plotly.graph_objs as go
import plotly as ply

# Create random data with numpy
import numpy as np

N = 100
random_x = np.linspace(0, 1, N)
random_y0 = np.random.randn(N)+5
random_y1 = np.random.randn(N)
random_y2 = np.random.randn(N)-5

# Create traces
trace0 = go.Scatter(
    x = random_x,
y = random_y0,
mode = 'lines',
name = 'lines'
)
trace1 = go.Scatter(
    x = random_x,
    y = random_y1,
    mode = 'lines+markers',
    name = 'lines+markers'
)
trace2 = go.Scatter(
    x = random_x,
    y = random_y2,
    mode = 'markers',
    name = 'markers'
)
data = [trace0, trace1, trace2]

ply.offline.plot(data, filename='line-mode')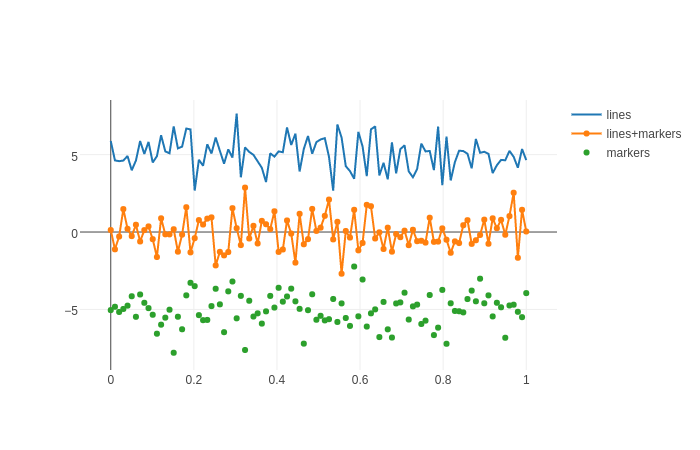
Plot