Plots with Common X-axis but different Y-axis Using twinx
suggest changeIn this example, we will plot a sine curve and a hyperbolic sine curve in the same plot with a common x-axis having different y-axis. This is accomplished by the use of twinx() command.
# Plotting tutorials in Python
# Adding Multiple plots by twin x axis
# Good for plots having different y axis range
# Separate axes and figure objects
# replicate axes object and plot curves
# use axes to set attributes

# Note:
# Grid for second curve unsuccessful : let me know if you find it! :(

import numpy as np
import matplotlib.pyplot as plt

x = np.linspace(0, 2.0*np.pi, 101)
y = np.sin(x)
z = np.sinh(x)

# separate the figure object and axes object
# from the plotting object
fig, ax1 = plt.subplots()

# Duplicate the axes with a different y axis
# and the same x axis
ax2 = ax1.twinx() # ax2 and ax1 will have common x axis and different y axis

# plot the curves on axes 1, and 2, and get the curve handles
curve1, = ax1.plot(x, y, label="sin", color='r')
curve2, = ax2.plot(x, z, label="sinh", color='b')

# Make a curves list to access the parameters in the curves
curves = [curve1, curve2]

# add legend via axes 1 or axes 2 object.
# one command is usually sufficient
# ax1.legend() # will not display the legend of ax2
# ax2.legend() # will not display the legend of ax1
ax1.legend(curves, [curve.get_label() for curve in curves])
# ax2.legend(curves, [curve.get_label() for curve in curves]) # also valid

# Global figure properties
plt.title("Plot of sine and hyperbolic sine")
plt.show()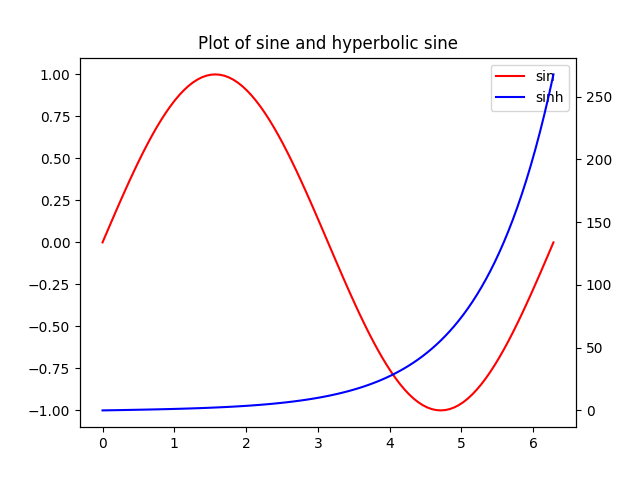
Found a mistake? Have a question or improvement idea?
Let me know.
Table Of Contents